Understanding your cardholders’ debit card usage
Article contributor / Brooke Jacobson / Data Analyst
Discussion around debit card usage often focuses on everyday spending, often smaller ticket items. But, you may want to also consider the following:
- Do you have actual data around your customer’s debit card usage?
- Do you know how much of your interchange income is coming from small ticket sizes versus large ones?
- Do you know how ticket size differs between your consumer and business customers?
- Do you know where your customers use your debit card most frequently?
Usage data specific to your cardholder’s behavior can help you tailor messaging to target audiences, which has a greater rate of success in influencing behavior and ultimately keeping your institution’s debit card top of wallet.
The following example visualizes the percent of interchange earned by ticket size and BIN program. 40% of interchange earned was from spending by consumer cards and tickets under $50. This small ticket everyday spending by consumer cardholders is a significant portion of non-interest income. However, stopping there misses another significant portion of usage because 20% of interchange was earned from ticket sizes over $250. This customer usage example highlights a significant impact on non-interest income.
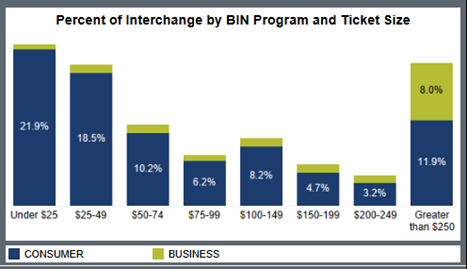
Furthermore, if we drill into this data by BIN program, we notice a stark contrast in usage.
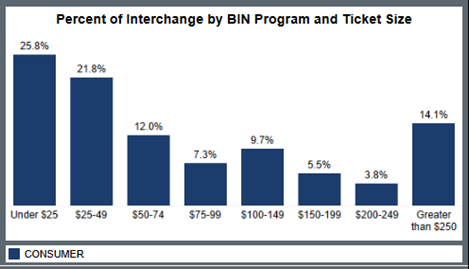
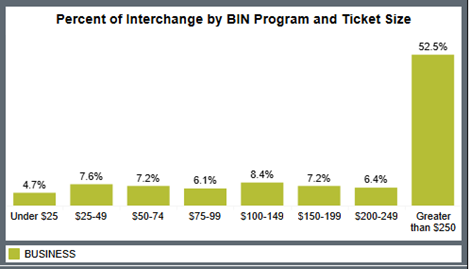
For consumer cardholders, over 47% of interchange came from tickets under $50. But 14% is also coming from tickets over $250. Business cardholders are overwhelmingly using their debit card for large tickets, with over 52% of interchange income from the business BIN coming from tickets over $250. Knowing this difference in usage means a financial institution can tailor different messaging to these cardholder groups. Communication with business cardholders can focus more on large ticket spending, while communication with consumer cardholders can highlight the benefits of debit for both everyday spending, as well as larger ticket items. These messages are more likely to resonate with them and impact their spending behavior.
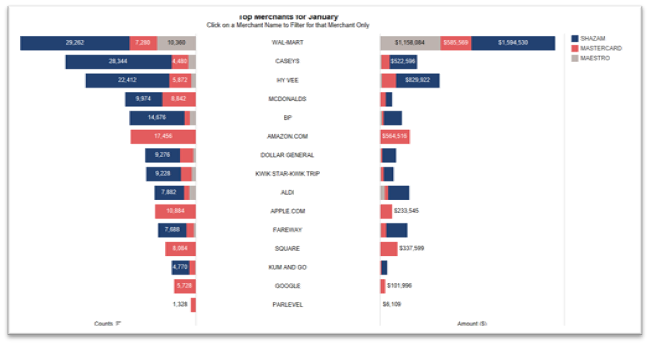
Top merchant insights
Similarly, understanding where cardholders use your institution’s debit card can help you gain insight into usage that can be used in customer communications. In this example, the top merchants chart shows the top 15 merchants where an institution’s debit card was used the prior month showing both the number of transactions (left-hand side of the chart) and the transaction volume (right-hand side of the chart). Grocery and gas merchants are popular in this example so messaging could include the value of using debit at the gas pump and when grocery shopping to continue to drive top-of-wallet status for those frequent spending areas. Benefits of using debit cards when shopping online could also be targeted to continue to increase usage there as well. Additionally, average ticket size for each top merchant can deepen your understanding of customer usage.
Using data for decision making
SHAZAM® Business Intelligence Services™ brings subscribers current data each month that can be leveraged for decision-making to keep your institution’s debit card top of wallet and positively impact your non-interest income. To schedule a complementary product demo, contact your Client Executive.